Statistics of Vietnam
Transportation Index for five major cities
Transportation Index for five major cities
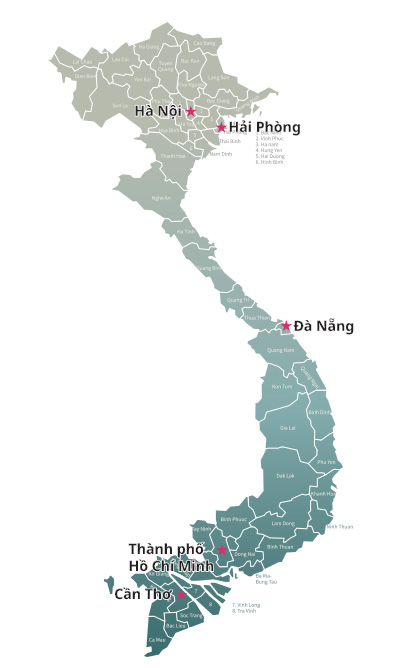
The cities analyzed in the framework of this index include Hanoi, Ho Chi Minh City(HCMC), Hai Phong, Da Nang and Can Tho, they are representing the 5 major cities.
1. Geographic Location and Economic Characteristics
The Geographical Location and Economic Characteristic of 5 Major Cities
| GDP (10Bln,VND) | Population (1000) | |
|---|---|---|
| Hanoi | 971,700 | 8,094 |
| Hai Phong | 230,125 | 2,033 |
| Da Nang | 112,000 | 1,141 |
| HCMC | 1,347,369 | 9,039 |
| Can Tho | 110,977 | 1,236 |
| Total | 2,772,171 | 21,543 |
| Vietnam | 6,037,348 | 96,484 |
| Contribution of 5 major cities to whole country | 45.9% | 22.3% |
2. Transportation Overview
1. Road transport
Comparing Road Quality of 5 Major Cities
| Criteria | The year of 2018 | ||||
|---|---|---|---|---|---|
| Can Tho | Hanoi | HCMC | Danang | Hai Phong | |
| Area (km2) | 1,439 | 3,358.6 | 2,061.2 | 1,284.9 | 1,561.8 |
| Population (1000 persons) | 1,272.8 | 7,420.1 | 8,444.6 | 1,064.1 | 1,997.7 |
| Total length of roads (km) In which:- Urban road |
3,300 20.95 |
20,761.52 1,989.89 |
4,202.65 1,827 |
1,235.59 930.36 |
4,127.71 324.5 |
| Urban Road density km/km2 | 0.14 | 0.59 | 0.89 | 0.72 | 0.21 |
| The rate of road area/total areas (%) | 1.83 | 5.00 | 1,63 | 0.77 | 2,11 |
List of Expressways (As of 31st December 2019)
| Cities | Total length (km) | Number of lanes | Type of pavement | Type of pavement | Bridge | |
|---|---|---|---|---|---|---|
| Number | Length (m) | |||||
| Hanoi – Thai Nguyen – Cho Moi | 104 | 4 | Concrete | 100 | 29 | 3,681 |
| Noi Bai – Lao Cai – Kim Thanh bridge | 264 | 4-6 | Concrete | 80-100 | 13 | 1,548 |
| Hanoi – Hai Phong | 105 | 6 | Concrete | 120 | 50 | 13,132 |
| HCMC – Trung Luong | 40 | 6 | Concrete | 100 | 21 | 16,359 |
| Phap Van – Cau Gie- Ninh Binh | 79 | 6 | Concrete | 120 | 14 | N/A |
| Da Nang – Quang Ngai | 139,2 | 4 | Concrete | 100 | N/A | N/A |
| Lien Khuong - Prenn | 19 | 4 | Concrete | 100 | 0 | 0 |
| Ha Noi – Bac Giang | 46 | 4 | Concrete | 100 | 9 | 2,373 |
| HCMC – Long Thanh – Dau Giay | 55 | 6 | Concrete | 120 | N/A | N/A |
| Ha Long – Bach Dang Bridge | 25.2 | 4 | Concrete | 100 | 7 | 6,953 |
| Ha Long – Van Don | 59.5 | 4 | Concrete | 100 | 30 | 34,774 |
| Hanoi Ring Road Nol. 3 (Evelated) | 28 | 4 | Concrete | 80 | 0 | 0 |
| Lang – Hoa Lac (Thang Long Avenue) | 29 | 6 | Concrete | 80 | 0 | 0 |
| Noi Bai – Nhat Tan Bridge | 15 | 6 | Concrete | 80 | 0 | 0 |
Vehicle in Operation by Cities, 2018
| No | Province | MC | Passenger Car | Intercity bus | Truck | Special vehicles | Urban bus | Total |
|---|---|---|---|---|---|---|---|---|
| 1 | Hanoi | 6,091,986 | 416,621 | 27,816 | 156,244 | 13,620 | 1,607 | 6.707.894 |
| 2 | Hai Phong | 1,191,492 | 48,899 | 4,206 | 39,750 | 16,120 | 84 | 1.300.551 |
| 3 | Da Nang | 892,960 | 41,472 | 4,517 | 22,199 | 3,536 | 156 | 71.880 |
| 4 | Hochiminh | 8,054,739 | 318,157 | 34,078 | 173,579 | 35,829 | 2,500 | 8.618.882 |
| 5 | Can Tho | 683,985 | 17,804 | 1,840 | 14,155 | 976 | 78 | 718.838 |
| Total | 16,022,202 | 842,953 | 72,457 | 405,927 | 70,081 | 4,425 | ||
Source: Vietnam Register 2018, TDSI published
2. Inland Waterway Transport
Length of National Inland Waterways by Technical Standard, 2018
| Cities | Length (km) | National Highway | |||||
|---|---|---|---|---|---|---|---|
| Special class | Class I | Class II | Class III | Class IV | Class V | ||
| Hanoi | 254.8 | 0 | 682 | 846.4 | 588 | 175.4 | 0 |
| Hai Phong | 241.8 | 0 | 7.7 | 147.8 | 50 | 36.5 | 0 |
| Da Nang | 19.7 | 0 | 4.0 | 0 | 2.4 | 3.0 | 10.3 |
| HCMC | 123.8 | 0 | 0 | 13.2 | 110.6 | 0 | 0 |
| Can Tho | 125.8 | 26.9 | 21.8 | 0 | 077.1 | 0 | 0 |
| Total | 626.8 | 164.5 | 31.4 | 94.5 | 257.4 | 71.3 | 7.7 |
Source: IWT administration 2018 and DOTs 2018
Registered Inland Waterway Vessels and Vessels Capacity by Cities
| No | Province | Number of vessels | Power Capacity (CV) | Carrying Capacity (pax.) | Deadweight (DWT) |
|---|---|---|---|---|---|
| 1 | Hanoi | 2,696 | 280,555 | 5,675 | 517,475 |
| 2 | Hai Phong | 3,479 | 658,089 | 19,792 | 1,057,372 |
| 3 | Da Nang | 619 | 60,003 | 4,236 | 48,916 |
| 4 | Hochiminh | 6,683 | 1,485,698 | 32,227 | 2,019,219 |
| 5 | Can Tho | 8,051 | 553,760 | 16,698 | 529,718 |
| Total | 21,528 | 3,038,105 | 8,628 | 4,172,100 | |
Source: Vietnam Inland Waterway Authority 2019, TDSI published
List of freight ports on national inland waterway (Class I ® Class III)
| Cities | Name of Port | Berth’s length (m) | Capacity (tons/year) | Carrying capacity of vessels | |
|---|---|---|---|---|---|
| Draught (m) | Deadweight (DWT) | ||||
| Hanoi | Khuyen Luong Port | 998.6 | 207,146 | 2.8 | 1,000 |
| Hanoi Port | 1,400 | 90,383 | Self-propelled 400, Barge 600 | ||
| Hong Van Port | 500 | 46,878 | 2.5 | 1,000 | |
| Son Tay Port | 400 | 196,769 | 3.0 | 1,000 | |
| Hoang Binh Port | 100 | 27,820 | 2.2 | ||
| Hai Phong | |||||
| Truong Nguyen Port | 190 | 3,948,861 | 5.5 | ||
| Dong Viet Port | 110 | 203,880 | 3,000 | ||
| Duc Hoa Port | 150 | 631,909 | 4.5 | ||
| Hai nam Port | 371 | 1,840,890 | 5.0 | ||
| Gia Duc Port | 480 | 5,430,828 | 5.0 | ||
| TB An Hoa Port | 85.7 | 112,983 | 3.5 | ||
| Ha Hung Anh Port | 86.0 | 915,579 | 5.0 | ||
| HCMC | Phuong Quan Port | 126 | 1,600,000 | 5,000 | |
| Long Binh Port | 339 | 1,500,000 | 5,000 | ||
| Mien Nam Logistics Port | 411 | 450,000 | 1,085 | ||
| Truong Tho Port | 620x30 | N/A | 4.0 | ||
| Hoang Long Port | 167 | 600,000 | 1.2 | 750 | |
| Thanh Tai Port | 165 | 1,500,000 | 5,000 | ||
| Tinh Nghia Port | 124 | 1,500,000 | 1,000 | ||
| Sai Gon Cement Port | 78 | 40,000 | 1,000 | ||
| 42 Ton That thuyet Port | 22x15 | N/A | 1.7 | ||
| Tanamexco | 445x26 | N/A | 4.5 | ||
| Transimex Port | 100 x14 | N/A | 2.2 | ||
| Phuc Long Port | N/A | 2.0 | |||
| Can Tho | Tan Cang Thot Not | 156,8 | 643,134 | 5.1 /td> | |
| Thanh Hung Cargo port | 75 | 60,419 | 3.8 | ||
List of freight ports on national inland waterway
| Cities | Name of Port | Berth’s length (m) | Technical Class | Carrying capacity of vessels | Capacity (tons/year) |
|---|---|---|---|---|---|
| Draught (m) | |||||
| Hanoi | Han River Port | 528 | I | 200,000 | N/A |
| Can Tho | Ninh Kieu Tourist Port | 180 | I | 1,164,404 | 2.4 |
| Ninh Kieu Restaurant and Hotel Port | 90 | III | 199,500 | 3,0 |
3. Aviation
List of Civil Airports
| Airport | Airport Class | Number of Aprons | Runway | Landing Aid Equipement System | Terminal Capacity | |||
|---|---|---|---|---|---|---|---|---|
| Length (m) | Width (m) | Night lighting | ILS/DME | Passenger | Cargo | |||
| Noi Bai Int. airport | 4E (Int.) | Simultaneously 90 | 3,200 | 45 | C | C | 10 | 403,000 |
| 4E (Do.) | 3,800 | 45 | C | C | 11 | |||
| Cat Bi Int. airport | 4E (both) | Simultaneously 11 | 3,050 | 2 | 1,000 | |||
| Da nang Int. airport | 4D(Int.) | 35 | 3,500 | 45 | C | C | 4 | 1,800 |
| 4D(Do.) | 3,048 | 45 | C | C | 6 | |||
| Tan Son Nhat Int. airport | 4E (Int.) | Simultaneously 106 | 3,048 | 45 | C | C | 13 | 550,000 |
| 4E (Do.) | 3,800 | 45 | C | C | 15 | |||
| Can Tho Int. airport | 4E (both) | 10 | 3,000 | 45 | C | C | 3 | 5,000 |
Source: Civil Aviation Authority 2018, TDSI published
arrowTOP