Statistics of Vietnam
Transportation Index
Transportation Index
1. Road
Road Network Length

Vehicle Statistics

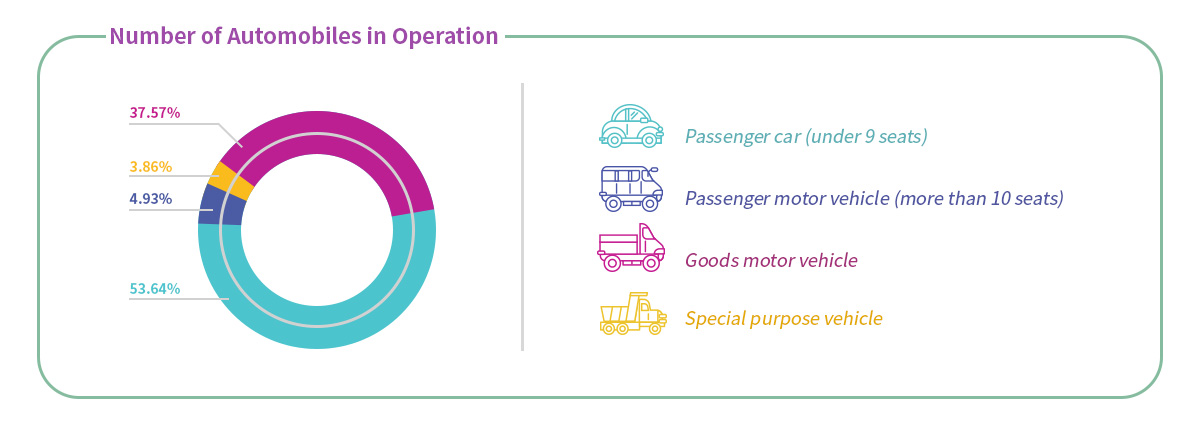
Until end of 2019, the number of automobiles reached over 3.9 mln. while motorcycles obtained 58.2 mln., about 15 times higher compared to the automobiles. Motorcycles accounted for 70% of traffic flow in the biggest cities.
Road Transport Volume & Performance
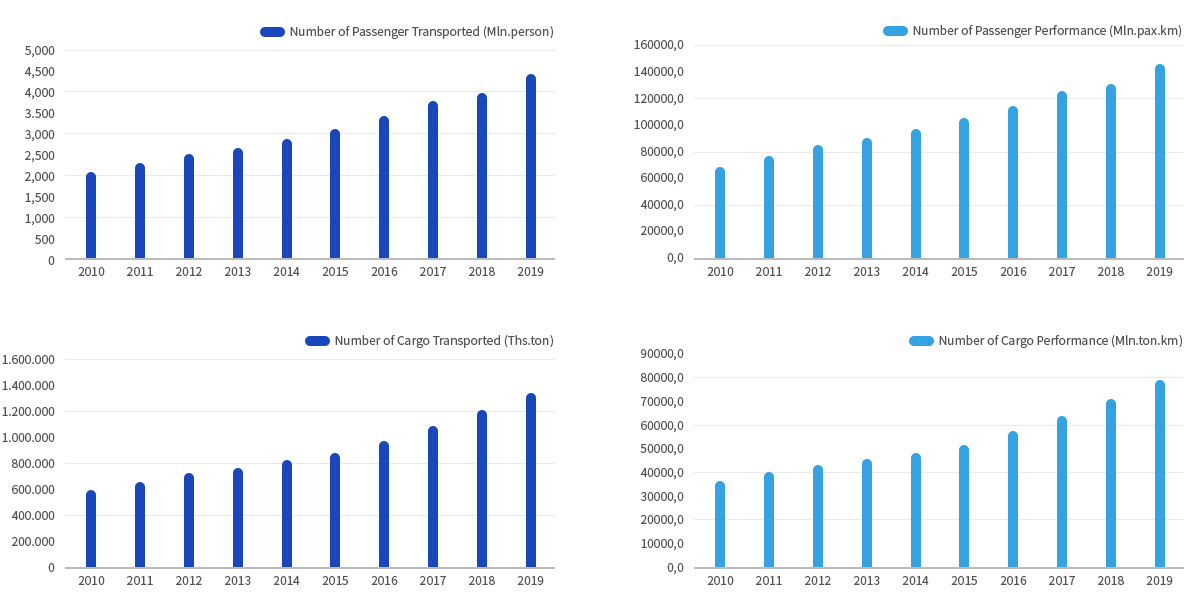
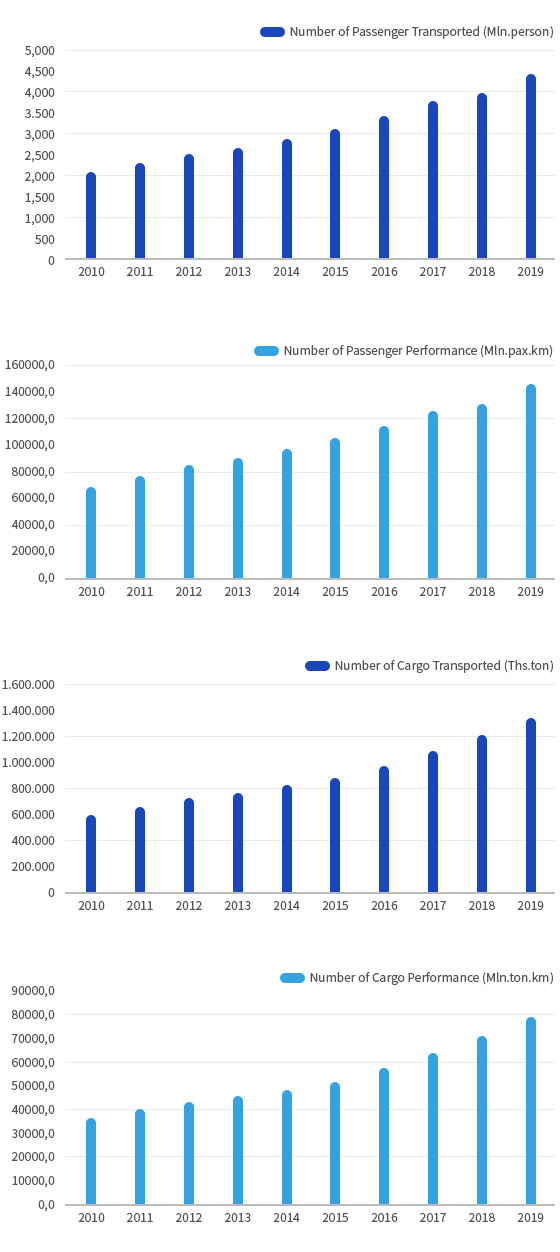
Volume of passenger transported increased from 2132 mln. person in 2010 to 4464 mln. person in 2019, with average growth of 8,6%/year. Passenger transport performance by roads grew from 69,197 mln.pax.km in 2010 to 145613 mln.pax.km in 2019, with the same annual growth rate. Number of cargo transport rose from 587 mln. ton in 2010 to 1341 mln. ton in 2019, with average growth rate of 9.6%/year, while cargo transport performance by roads increased 9.1%/year, from 36179 mln.ton.km in 2010 to 78961 mln.ton.km in 2019.
2. Railway
Railway Infrastructure

Viet Nam’s railway network consist of 7 main railway lines with a total length of 3,162.9 km in 2018, including 2,703.2 km of main lines, 459.7 km of station’s inner lines and branch lines.
Railway Transport Volume & Perforamance
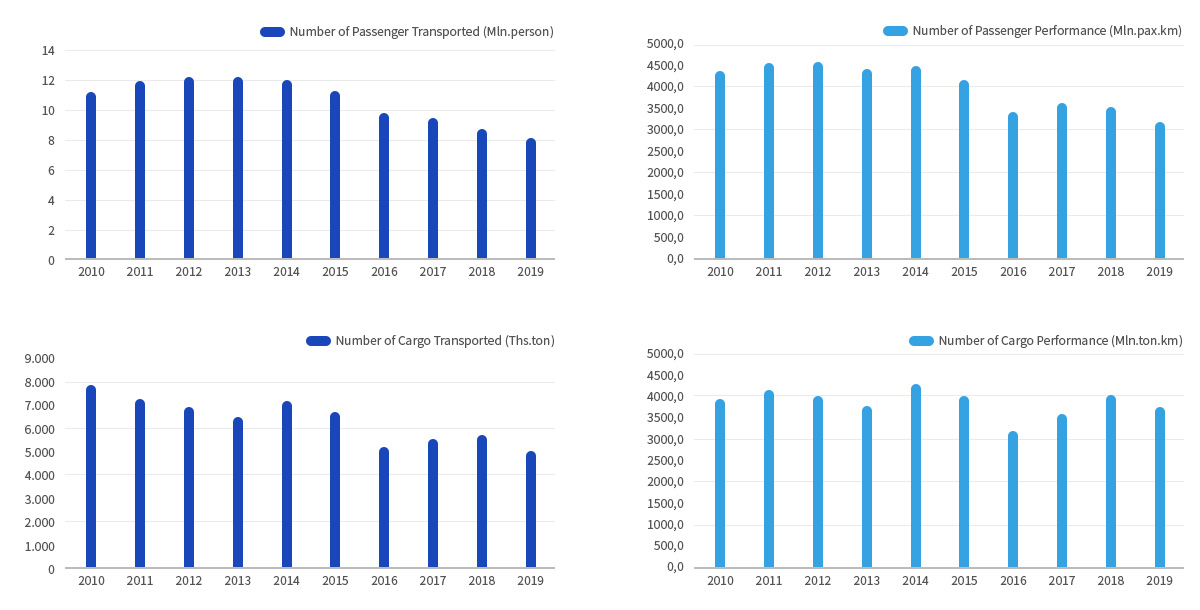
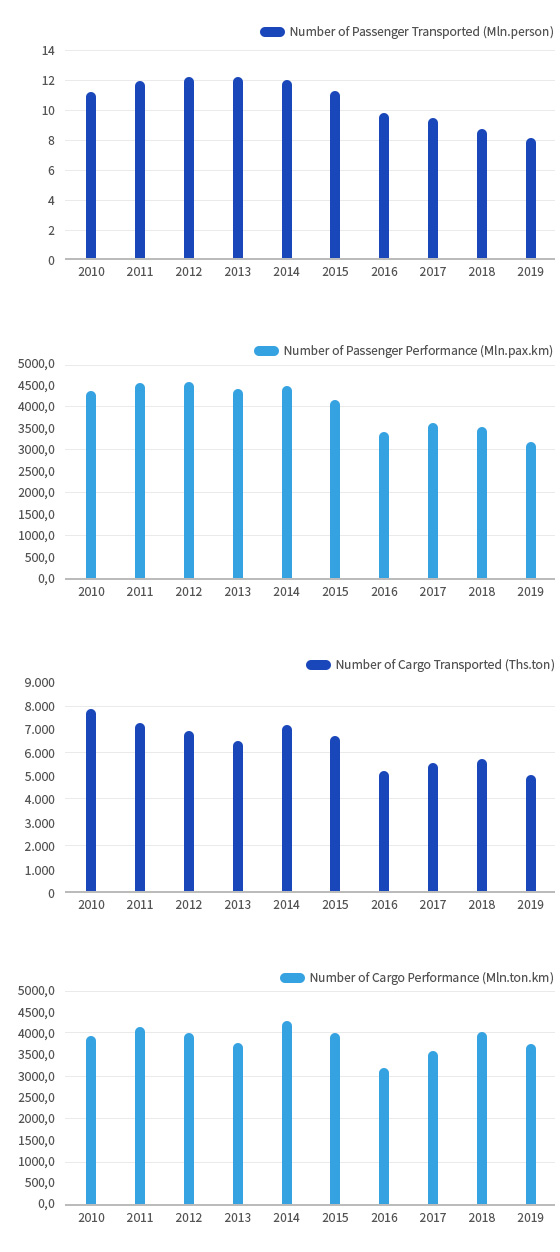
Freight traffic by railways accounted for a low proportion compared to other modes of transport. Volume of freight carried decreased from 7.9 mln. ton in 2010 to 5.1 mln. ton in 2018, with average growth rate of -4.7%/year. Freight transport performance by railways declined from 3,961 mln.ton.km in 2010 to 3,762 mln.ton.km in 2019, with average growth of -0.6%/year. The number of passengers transported decreased from 11 mln. person in 2010 to 8 mln. person in 2019, with average growth of -3.5%/year. Passenger transport performance by railways reduced from 4,378 mln.pax.km in 2010 to 3,171 mln.pax.km in 2019.
3. Inland Waterway
IWT Infrastructure, 2018

IWT Volume & Performance
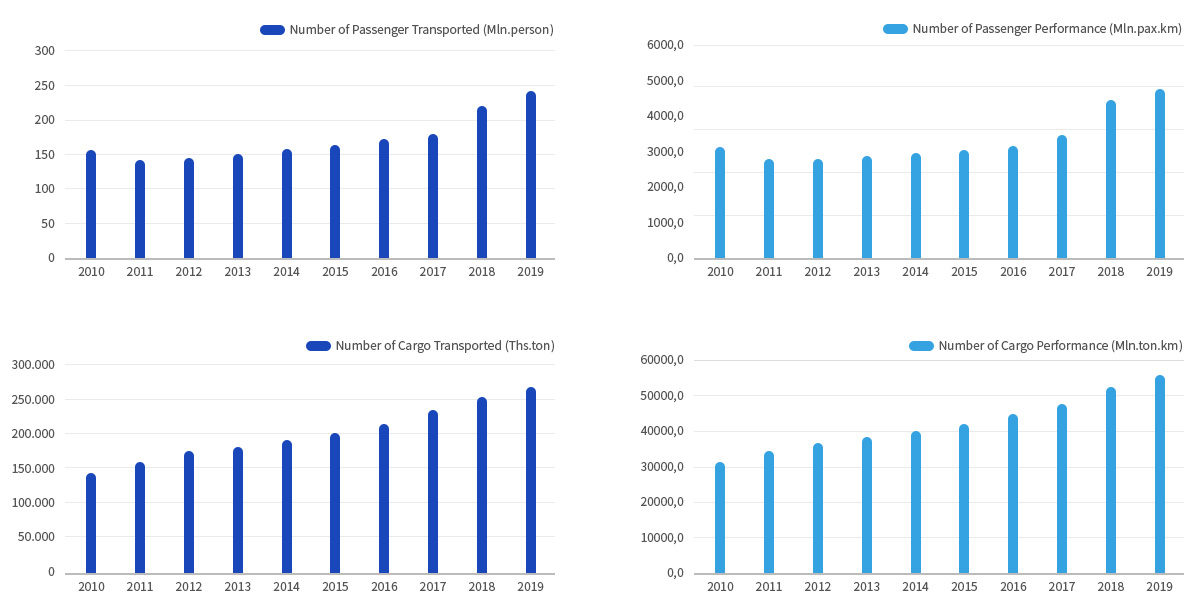
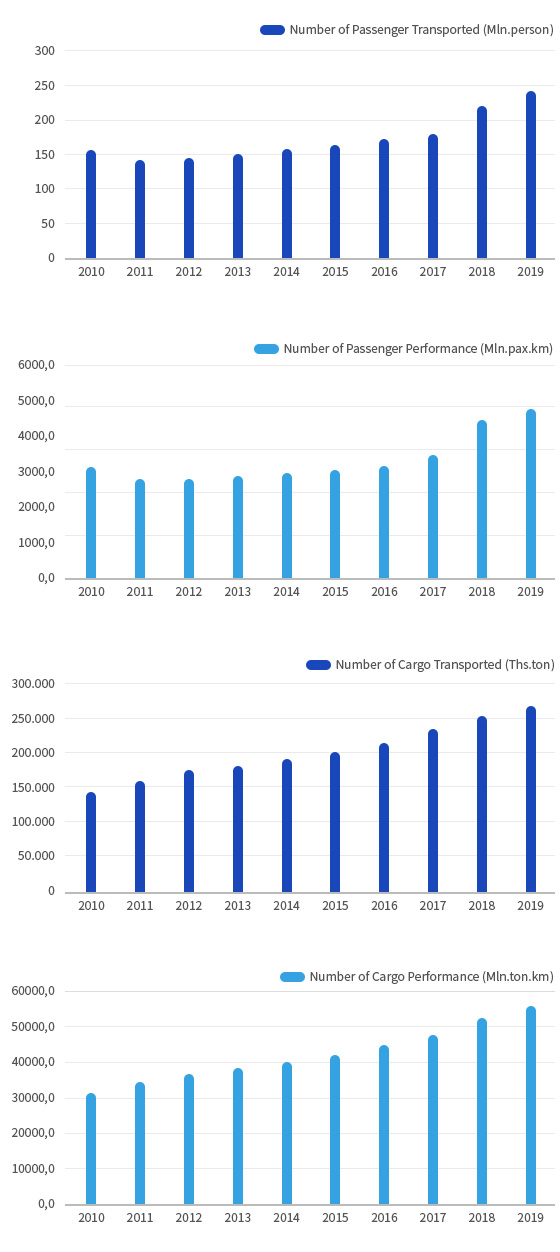
IWT traffic accounted for a small proportion compared to other transport modes. Volume of freight carried by IWT increased from 144 mln. ton in 2010 to 266 mln. ton in 2019, with average growth rate of 7.0%/year. Freight transport performance by inland waterways rose from 31,679 mln.ton.km in 2010 to 55,946 mln.ton.km in 2019, with average growth rate of 6.5%/year. The number of passenger transport by IWT grew from 158 mln. people in 2010 to 242 mln. people in 2019, with average growth rate of 4.9%/year. Passenger transport performance by inland waterways increased from 3,195 mln.pax.km in 2010 to 4,813 mln.pax.km in 2019, with average growth rate of 4.7%/year.
4. Maritime
Maritime Infrastructure, 2018

Maritime Volume & Performance

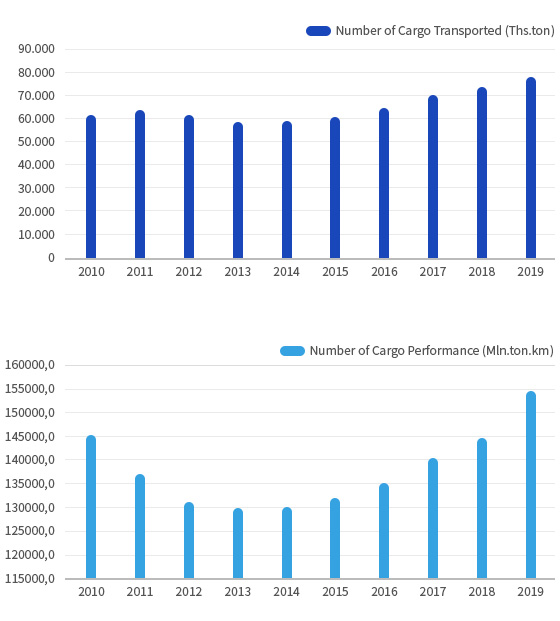
The volume of freight transport by sea increased from 61.6 mln. tons in 2010 to 77.9 mln. tons in 2019, with average growth rate of 2.6%/year. Freight transport performance by sea rose from 145,521 mln.ton.km in 2010 to 154,753 mln.ton.km in 2019, with average increase of 0.7%/year.
5. Aviation
Aviation Infrastructure, 2018

Aviation Volume & Performance
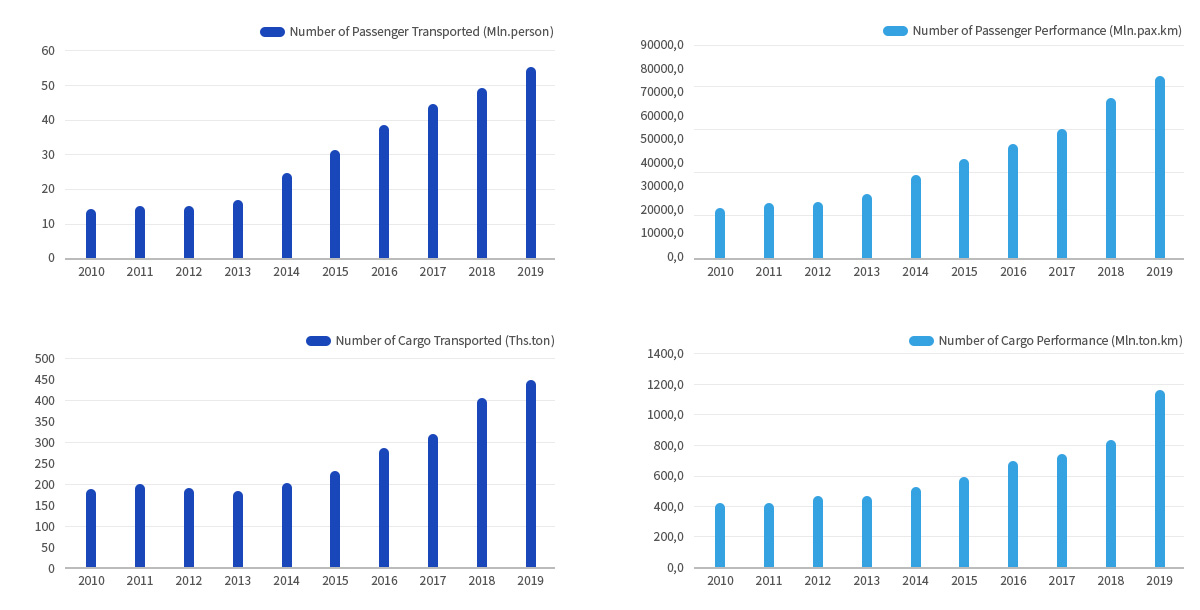
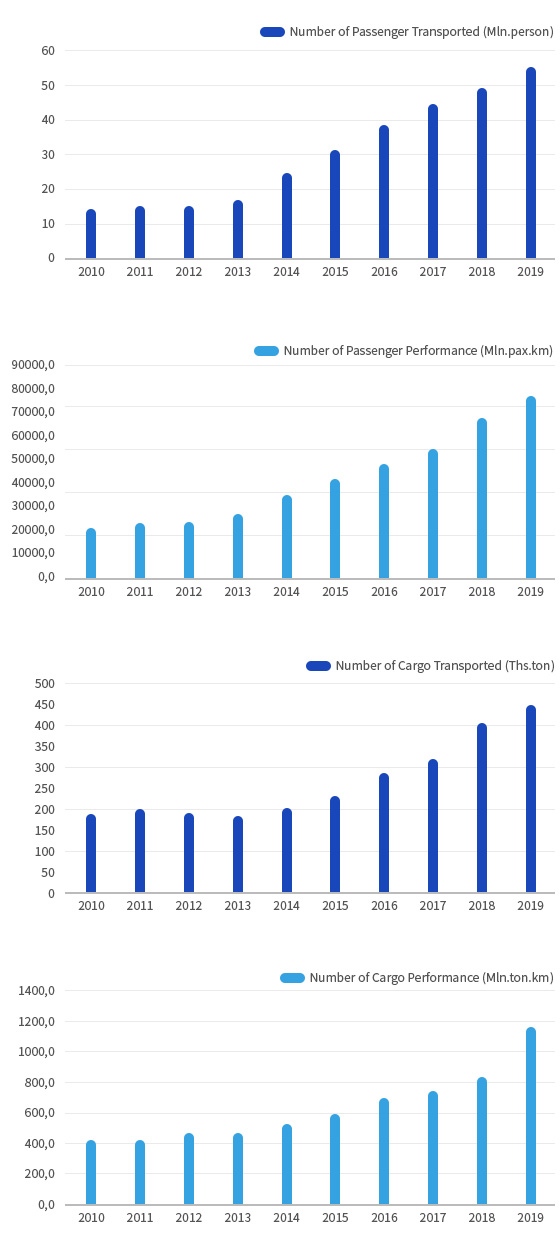
Air traffic for freight and passenger has the smallest proportion in term of fleet but have a significant increase in recent years. Volume of freight transport increased from 0.2 mln. ton in 2010 to double in 2019, with average growth of 10%/year. Freight transport performance increased from 427 mln.ton.km in 2010 to 1169 mln.ton.km in 2019, an increase of 11.8%/year. The number of passenger transport increased from 14 mln. person in 2010 to 55 mln. person in 2019, with an average growth rate of 16.2%/year. Passenger transport performance by air grew from 21,162 mln.pax.km in 2010 to 77,184 mln.pax.km in 2019, the average growth rate of 15.5%/year.
6. On-going and Required Transport and Logistics Infrastructure Projects
List of Projects prepared by MOT
| No | Name of Project | Province | Source of Budget | Investment Approval Unit | Investor |
|---|---|---|---|---|---|
| 1 |
Upgrade NH 46 section Vinh – Nam Dao |
Nghe An |
State |
MOT |
MOT |
| 2 |
Upgrade NH 12C section Vung Ang Port – Dong Le |
Ha Tinh |
State |
MOT |
MOT |
| 3 |
Upgrade NH12A section Khe Ve - Cha Lo |
Quang BInh |
State |
MOT |
MOT |
| 4 |
Upgrade NH 12A section avoid Ba Don and section avoid Song Gianh cement factory |
Quang BInh |
State |
MOT |
MOT |
| 5 |
Construct and upgrade NH 9B section Km0-Km4 (Quan Hau - Vinh Tuy) and Km20-Km52 (T-junction Vạn Ninh - Tang Ky) |
Nghe An |
State |
MOT |
MOT |
| 6 |
Upgrade NH 217 section NH1A-Hochiminh road |
State |
MOT |
MOT |
|
| 7 |
Upgrade NH48, section Km20-km38 |
Nghe An |
State |
MOT |
MOT |
| 8 |
Upgrade NH , section Km0-Km36 and section Khe Thơi - Nậm Cắn |
State |
MOT |
MOT |
|
| 9 |
Upgrade NH15 (Tan Ky – Do Luong) |
Quang BInh |
State |
MOT |
MOT |
| 10 |
Upgrade & Expand NH48B (Section km12+500- km25) |
Nghe An |
State |
MOT |
MOT |
| 11 |
Upgrade NH49 |
Nghe An |
State |
MOT |
MOT |
| 12 |
Construct and Upgrage NH15D section NH1-Cam Lo, La Son Expressway and section Western HCM road – La Lay gate |
State |
MOT |
MOT |
|
| 13 |
Expand NH1 section Km 996+889 - Km999+2189 |
Quang Nam |
State |
MOT |
MOT |
| 14 |
Expand NH1 section Duy Xuyen - Phu Ninh |
Quang Nam |
State |
MOT |
MOT |
| 15 |
Upgrade NH14E section km16-km89 (Quang Nam) |
Quang Nam |
State |
MOT |
MOT |
| 16 |
Upgrade QL14D , section Km10-Km37 and Km56-Km74 |
Quang Nam |
State |
MOT |
MOT |
| 17 |
Upgrade QL40B |
Quang Nam, Kontum |
State |
MOT |
MOT |
| 18 |
Upgrade QL24B section Km23-km57+170 |
Quang Nghai |
State |
MOT |
MOT |
| 19 |
Upgrade QL 25 |
Phu Yen, Gia Lai |
State |
MOT |
MOT |
| 20 |
Upgrade QL 26 sections chưa có đầu tư |
Khanh Hoa |
State |
MOT |
MOT |
| 21 |
Upgrade QL55 section Km52+640 - Km97+692 |
Binh Thuan |
State |
MOT |
MOT |
| 22 |
Upgrade NH 45 section Km0 - Km130 |
Thanh Hoa, Ninh Binh |
State |
MOT |
MOT |
| 23 |
Upgrade NH47B |
Thanh Hoa, Ninh Binh |
State |
MOT |
MOT |
List of on-going transport projects sponsored by major international parties
| Name of Projects | Detail | Total Amount (Mil USD) | Donor | Expected Year of Completion | Remark |
|---|---|---|---|---|---|
| Da Nang - Quang Ngai |
|
1243 |
World Bank (631 million USD); JICA (673 million USD); counterpart funding from the Vietnamese government |
2018 - |
Project component sponsored by JICA is delayed. Loan agreement with JICA will be terminated in 2024 |
| HCM - Long Thanh - Dau Giay (expansion) |
|
426 |
JICA; Government: counterpart fund for land acquisition |
2025 |
|
| Ben Luc - Long Thanh |
|
1600 |
ADB: 40%; JICA: 40%; Gov: 20% |
2022-2023 |
Loan Agreement with ADB is extended to 2023 |
| Lach Huyen |
|
1,121 |
P1: JICA (21 Billion JPY) |
2018 - |
Under-construction
|
| Ha Noi Urban railway Line1 (P1) |
|
865 |
JICA : 71%; Gov : 29% |
after 2020 |
Contracted, but temporary stop |
| Ha Noi Urban railway Line2 (P1) |
|
869 |
JICA : 84%; Gov : 16% |
after 2020 |
Land clearance, but delay
|
| HCM Urban railway Line1 |
|
2,103 |
JICA : 89%, Gov : 12% |
2022-2023 |
Under-construction |
| HCM Urban railway Line2 |
|
1,374 |
ADB : 36%; Private : 23% Others (Germany, EIB, KFW) : 41% |
2025 |
Planning + bidding process |


